Today we will learn how we debug a PHP application inside a DOCKER container with VSCODE. Debugging a PHP application using a debugger has a lot of benefits. It gives you insights into the code that you can never have while using manual debugging techniques such as var_dump(); die;.
With XDEBUG we can see the execution flow of the program and can examine variables just by adding breakpoints in our IDE effortlessly. XDEBUG enables us to navigate and understand complex codebases with ease and helps in identifying and fixing problems in our code that are usually very hard to find without a debugger.
Another benefit of using XDEBUG is that we can execute our custom PHP code on breakpoints and change the behaviour of the code to test and debug.
The code we are going to write is already available on github https://github.com/sajjad26/docker-php-xdebug-vscode so you can follow this tutorial with ease.
Let’s start by creating a directory and the necessary files first.
Directory Structure and Files
We are going to need following directories and files for this application to work.
docker-php-xdebug-vscode
    - .vscode
        - launch.json
    - docker
        - site.conf
        - xdebug.ini
    - cli.php
    - docker-compose.yml
    - Dockerfile
    - index.php
Now that we know the files we are going to need lets create all the files one by one and also explain the contents.
Dockerfile
Lets first create the Dockerfile. In our Dockerfile we are extending the php:8-fpm image and installing xdebug-3.1.3 on top of it.
FROM php:8-fpm

RUN pecl install xdebug-3.1.3 \
    && docker-php-ext-enable xdebug
docker-compose.yml
Now that we have our Dockerfile ready lets create our docker-compose.yml file which will use our Dockerfile to build and start our application. Lets create a new file named docker-compose.yml in the root of the project and put the following code in it.
version: "3"
services:
  webserver:
    image: nginx:latest
    ports:
      - "8080:80"
    volumes:
      - "./:/var/www/html"
      - "./docker/site.conf:/etc/nginx/conf.d/default.conf"

  php:
    build:
      context: .
    volumes:
      - "./:/var/www/html"
      - ./docker/xdebug.ini:/usr/local/etc/php/conf.d/docker-php-ext-xdebug.ini
    extra_hosts:
      - "host.docker.internal:host-gateway"
I will not go into too much details about the contents of docker-compose.yml file but will point out things that are of interest to us.
We are creating 2 services named webserver and php. webserver as the name indicates is going to be the webserver that will serve our application to the browsers and will communicate with our php service to execute php code. And the php service will be responsible to executing the php scripts
We are using volumes to mount our project files inside the docker containers. We are mounting our application code to a directory /var/www/html inside both services ( containers ). We are also mounting the docker/xdebug.ini to /usr/local/etc/php/conf.d/docker-php-ext-xdebug.ini in the php container ( service ) and the docker/site.conf to /etc/nginx/config.d/default.conf in webserver container ( service )
xdebug.ini
Lets create the xdebug configuration file in docker/xdebug.ini and put the following contents in it
zend_extension=xdebug

[xdebug]
xdebug.mode=develop,debug
xdebug.client_host=host.docker.internal
xdebug.start_with_request=yes
Here we are setting the xdebug.mode to develop, debug which enables us to add breakpoints in our code and debug. There a more values that you can use here like coverage, profile, trace but we are not going to use them here. If you want to know in detail what each of these options do please read the xdebug documentation here
xdebug.client_host value tells xdebug the host we want to connect for debugging sessions, in our case it will be our local machine. In docker you can not access your host machine as localhost instead we have created this host host.docker.internal in our docker-compose.yml file to point to our host machine.
You can learn more about xdebug.start_with_request setting on the xdebug documentation
site.conf
Lets create the nginx configuration file in docker/site.conf and put the following contents in it
server {
    listen 80 default_server;
    listen [::]:80 default_server;

    index index.php index.html;

    error_log  /var/log/nginx/error.log;
    access_log /var/log/nginx/access.log;
    root /var/www/html/;

    location ~ \.php$ {
        try_files $uri =404;
        fastcgi_split_path_info ^(.+\.php)(/.+)$;
        fastcgi_pass php:9000;
        fastcgi_index index.php;
        include fastcgi_params;
        fastcgi_param SCRIPT_FILENAME $document_root$fastcgi_script_name;
        fastcgi_param PATH_INFO $fastcgi_path_info;
    }
}
This is file is used by nginx to serve our application to web browsers. It sends the php code scripts to php service ( container ) for execution and sends back the response to the browser. If you are interested in learning more about how nginx works with php have look at this tutorial
index.php
The index.php is going to be a very simple file with following contents.
$a = 'Test';
$b = 1;

echo $a . '<br />';
echo $b . '<br />';
launch.json
This file is responsible for configuring the VSCODE debugging. The contents are listed below
{
    "version": "0.2.0",
    "configurations": [
        {
            "name": "Listen for Xdebug",
            "type": "php",
            "request": "launch",
            "port": 9003,
            "pathMappings": {
                "/var/www/html": "${workspaceFolder}"
            }
        },
    ]
}
This file is generated by VSCODE and the most important settings are port and pathMappings. The value of port is 9003 as for xdebug 3 the default value is 9003. In pathMappings we are telling the debugging server the directory it should map to our host machine directory so the IDE and XDEBUG can find the files properly.
Running the Docker Application
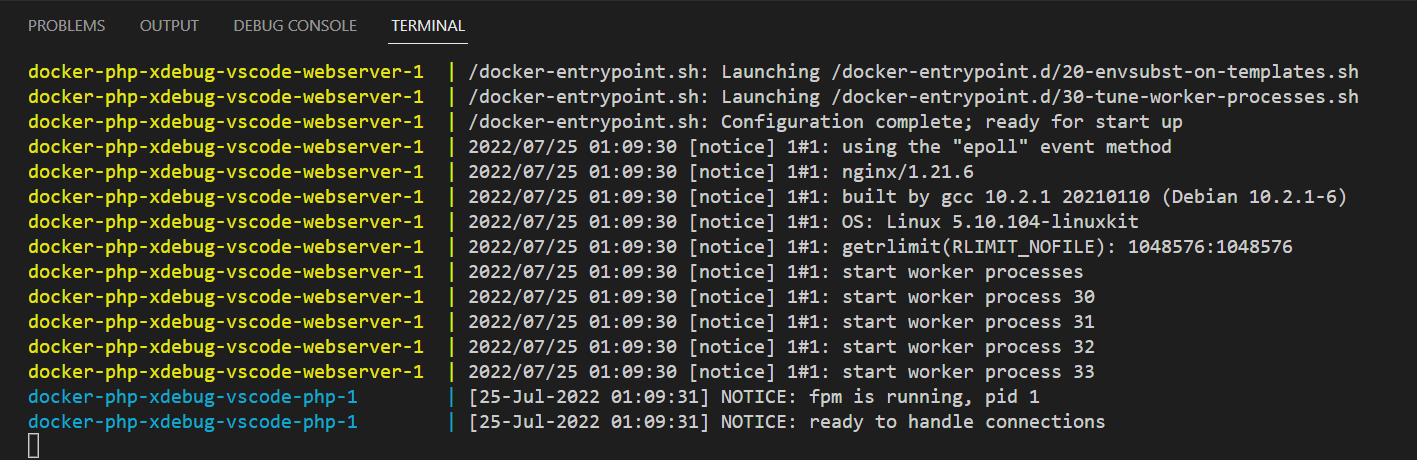
Now that we have all the files needed already created it is time to run our application for the first time. To run the application open the project directory in VSCODE and open New Terminal by clicking Terminal > New Terminal from the top menu and run docker compose up
This will build our entire application and will also start it if everything goes well. After the command completes successfully you will see some output in the terminal window.
Now open your browser and go to http://localhost:8080 and you should be able to see the output of your index.php script in the browser.
Debugging With XDEBUG
Now that we have our application running we can do the fun stuff of actually debugging our application. Open VSCODE and go to the debug page and click the Start Debugging button or press F5 to start the debugging session as shown in the image below.
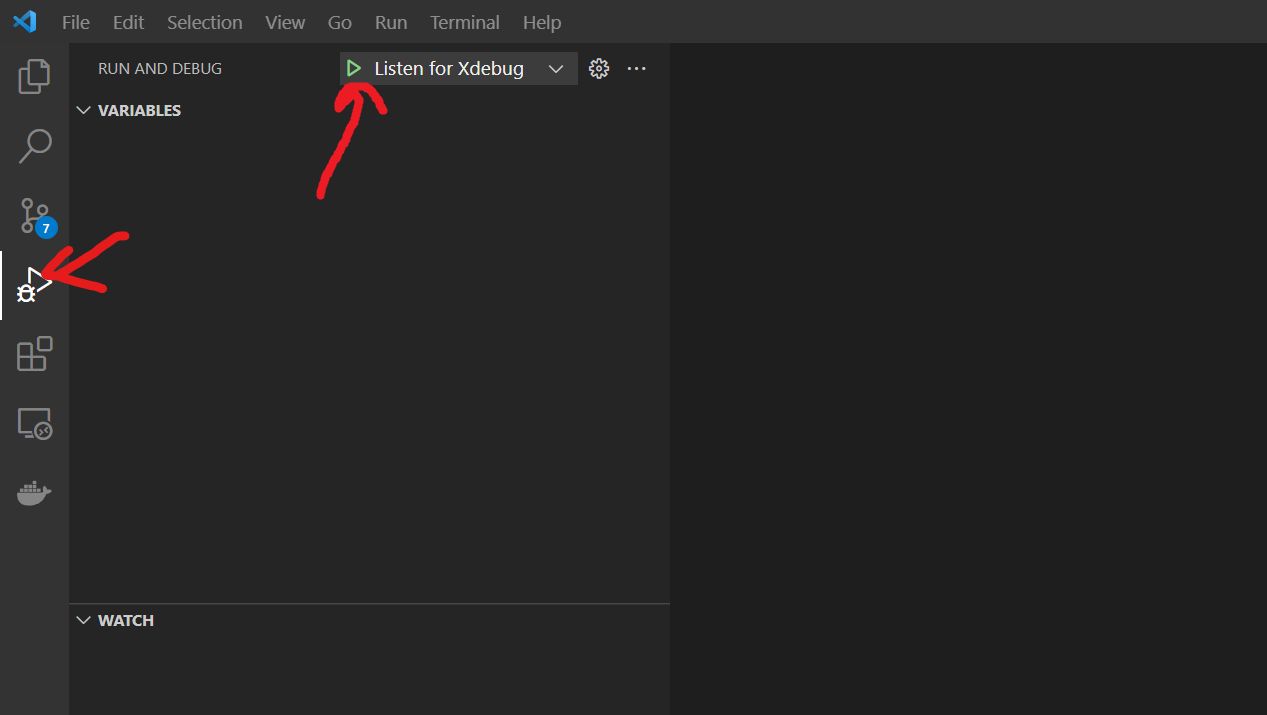
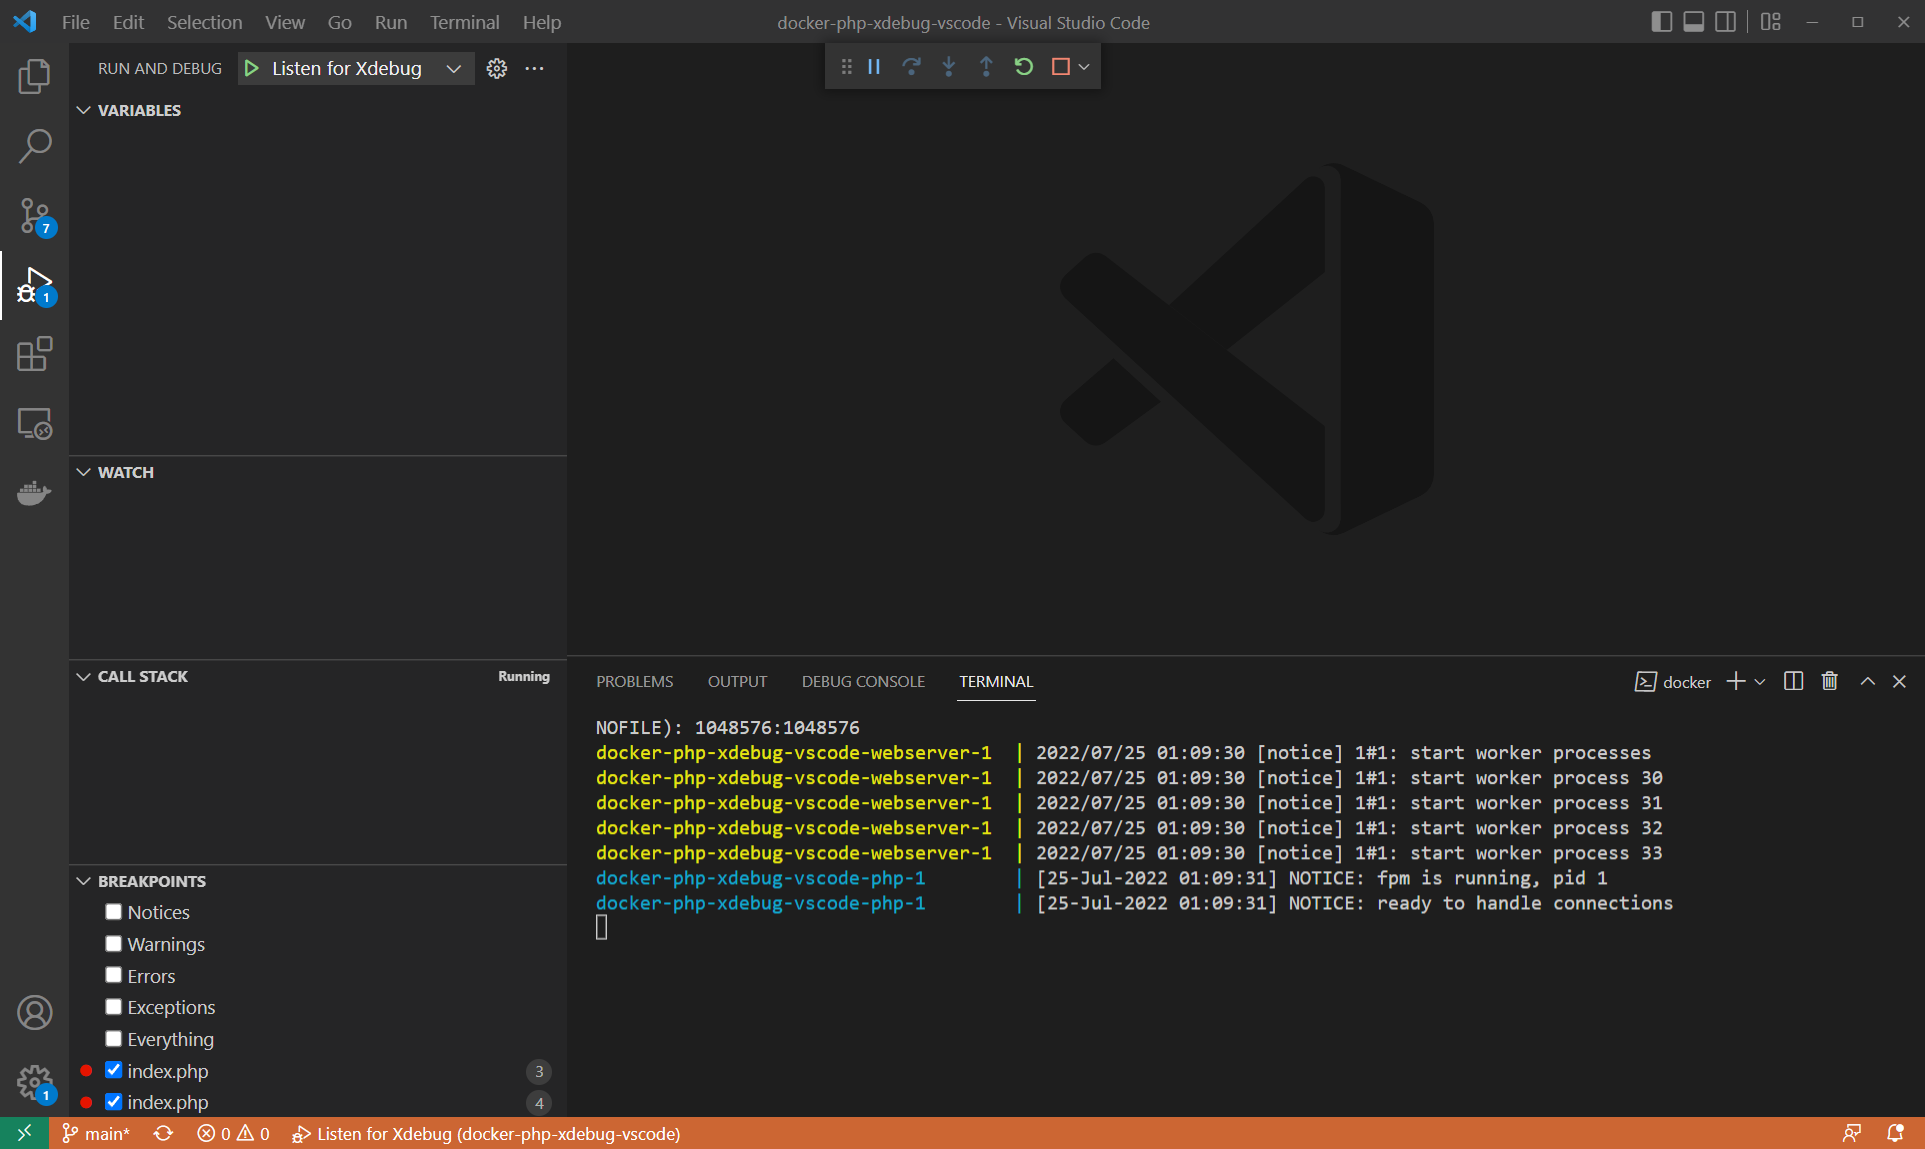
You should see a orange bar at the bottom of the VSCODE. It indicates that the IDE is listening for incoming debugging session requests.
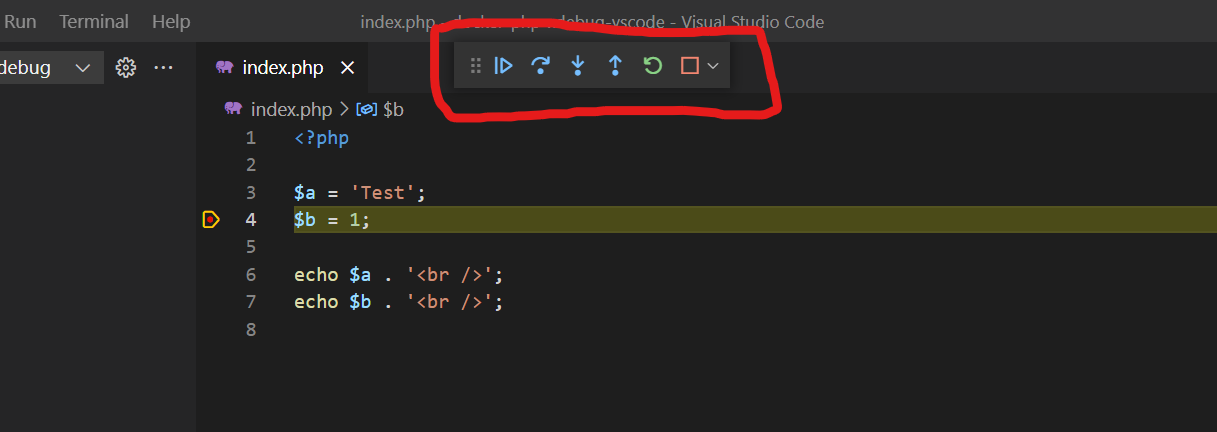
Now that our debugging server is running, open index.php and set a new breakpoint at line number 4 by clicking on the red dot that appears when you hover over the line number. Now go to your browser and reload http://localhost:8080 page. Now go to VSCODE and you should see line number 4 highligted which means that we have started a debugging session and the program is now paused at line number 4.
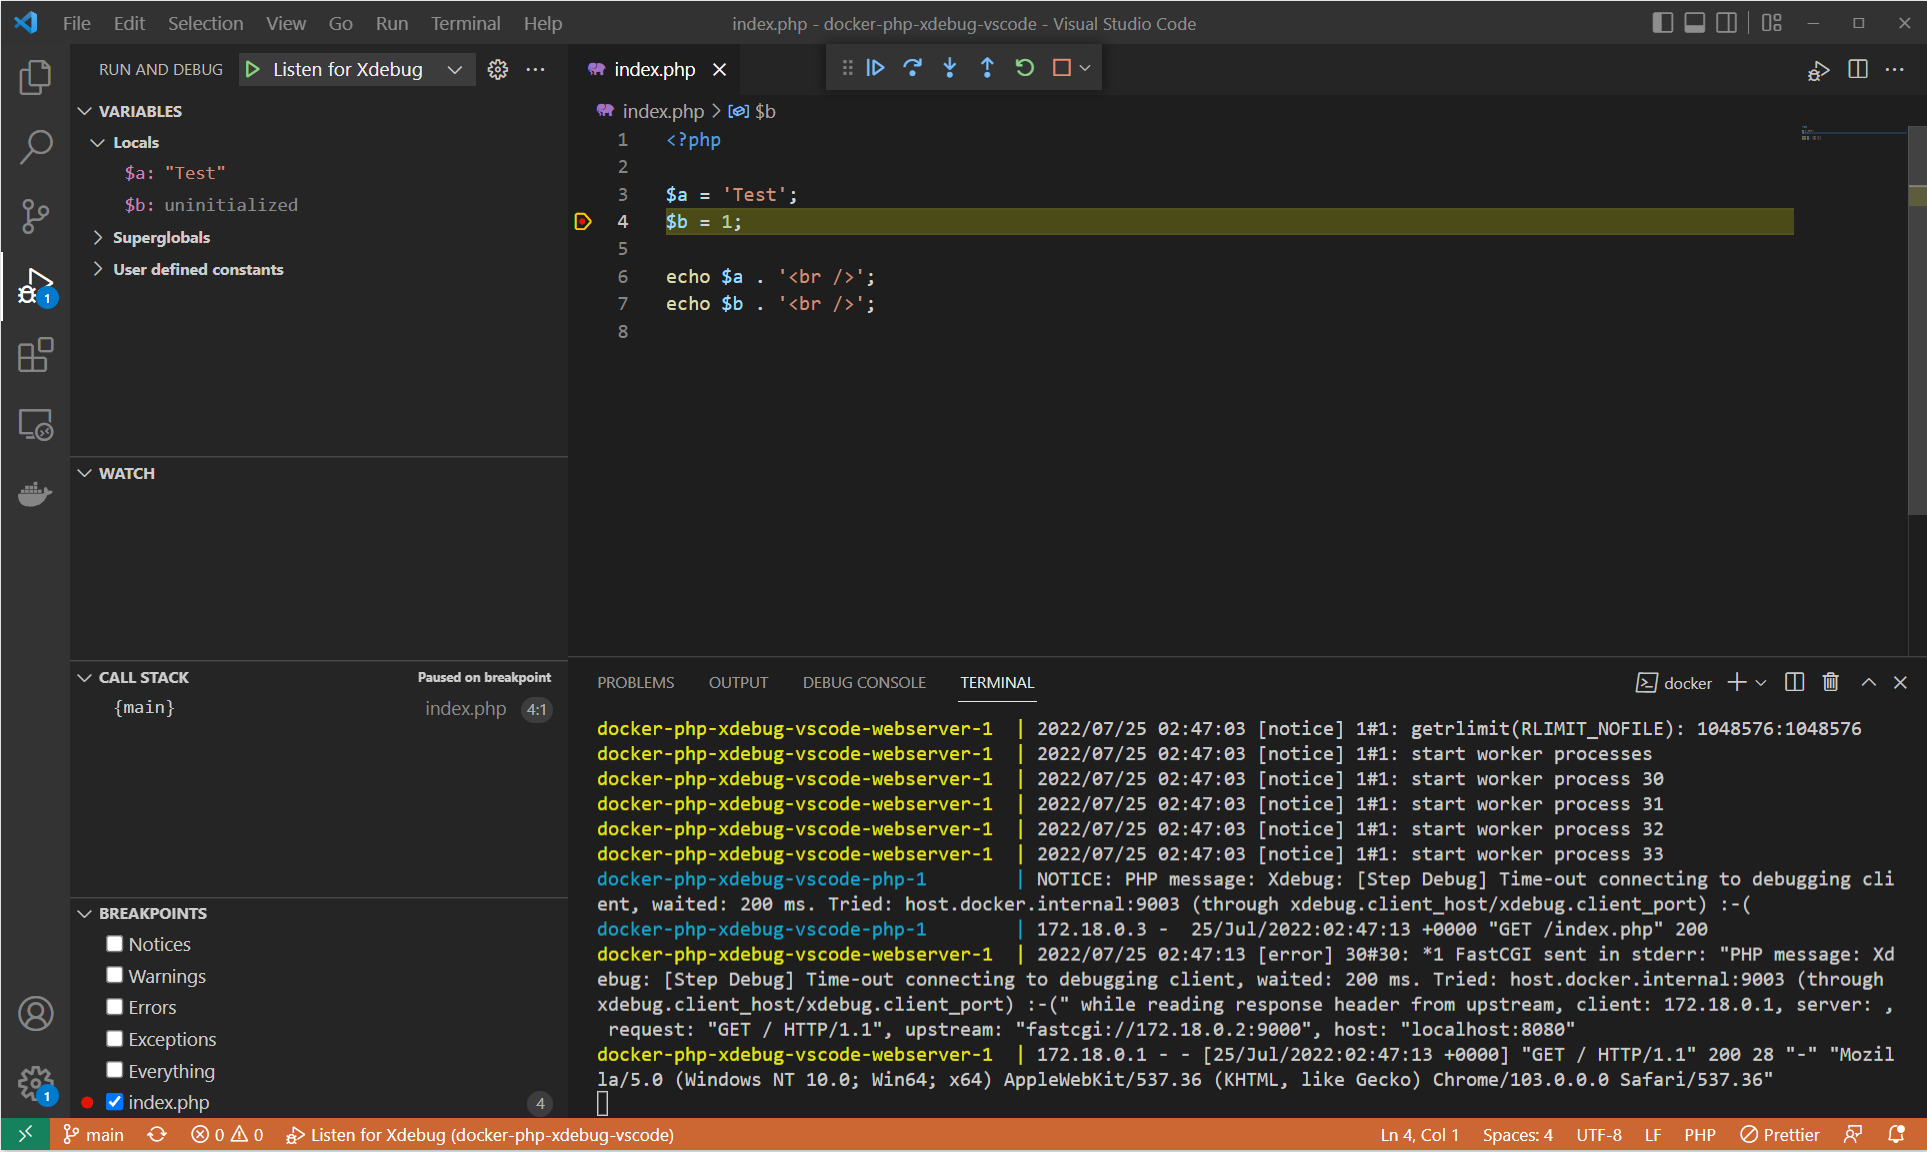
You also see a small set of buttons in the top center of VSCODE which has buttons for Continue, Step Over and other buttons which you can use to move forward in your code either line by line or breakpoint by breakpoint.
You should also see 4 panels in your editor sidebar named VARIABLES, WATCH, CALL STACK and BREAKPOINTS. All of these panels are useful while debugging and I will surely write a detailed post about how to use them to our advantage very soon.
Thats all for the day, I hope you now know more then you used to before reading this article about debugging php applications with xdebug in vscode. Let me know if I have missed something in the comments. Cheers.